
Aandeelinformatie Expeditors International | Filter Basic-Info
Aandeel: Expeditors International (VS Tech), ISIN: US3021301094
| Koers | 114.34 | Hoogste koers | 129.93 |
| Laagste koers | 106.73 | 1-jrs rend. | 10.03 |
| Sector | Industrie | Subsector | Transport / Logistiek |
| Jaarverslag 2020 |
Contactinformatie:Staat: 1015 third AvenuePostcode: 98104Stad: SeattleLand: VSTelefoon: (206)6743400Email: employeerelations@expeditors.comWebsite: www.exediors.comCEO: Peter J. RoseCFO: Bradely S. Powell
Sectorvergelijking Expeditors International
| Jaar | Omzet | Totaal omzet sector | Marktaandeel |
|---|---|---|---|
| 2019 | 8,175 | 882,284 | 0.93 % |
| 2020 | 10,117 | 890,403 | 1.14 % |
| 2021 | 16,524 | 1,091,412 | 1.51 % |
| 2022 | 17,071 | 1,285,203 | 1.33 % |
| 2023 | 0 | 0 | 0.00 % |
Adviezen Expeditors International
Nieuws Expeditors International
No Records Found
Rapporten Expeditors International
| 2017 | 2018 | 2019 | 2020 | 2021 |
|---|---|---|---|---|
Profiel Expeditors International
|
||||||||||||||||||
| ||||||||||||||||||
|
De belangrijkste details rondom het aandeel Expeditors Int. nemen we hier door. Hier behandelen we in het kort:
Expeditors Int. is als transport-logistieke bedrijf actief en komt uit Amerika. Andere spelers in deze sector zijn onder andere Batavia Prosperindo Trans Tbk PT, Arshiya, Dawine en Yonwoo Co. Het transport-logistieke bedrijf opereert vanuit haar hoofdkantoor Seattle.
Het Amerikaanse bedrijf had eind 2019 ruim 18 duizend medewerkers in dienst. Al het bedrijf's jaarverslagen bevinden zich hier.
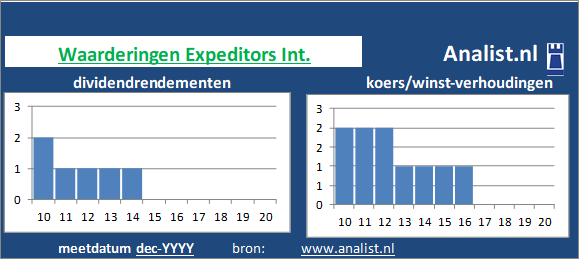
Medio 2020 lag de koers/winst-verhouding van het aandeel 4. We kunnen zeggen dat Expeditors Int. op basis van haar historische dividendrendementen en koers/winst-verhoudingen als een beperkt dividend waardeaandeel getypeerd kan worden.
Waarderingen en dividenden aandeel Expeditors Int.
2020 positief voor Expeditors Int.-beleggers
Rendementen aandeel Expeditors Int.
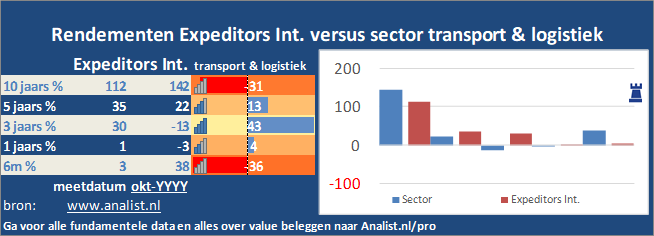 Sinds 2015 steeg het aandeel gigantisch. 75 procent won de transport & logistieksector sinds 2010. Sinds 2015 staat de sector 8 procent hoger en over het voorbije jaar (augustus 2019 - augustus 2020) staat Expeditors Int.'s peergroup op 5 procent verlies.
 Op basis hiervan kunnen het aandeel een zogenaamde megacap noemen.
In totaal was het bedrijf medio 2020 op de beurs rond de 82,9 miljard dollar waard.
Resultaten Expeditors International
| Resultaten |
2015
|
2016
|
2017
|
2018
|
2019
|
2020
|
|---|---|---|---|---|---|---|
| Omzet |
6,617
|
6,098
|
6,921
|
8,138
|
8,175
|
10,117
|
| Kosten |
6,159
|
5,667
|
6,432
|
7,520
|
7,585
|
9,420
|
| Nettowinst |
457
|
431
|
489
|
618
|
590
|
696
|
| Winstmarge |
6.91
|
7.06
|
7.07
|
7.60
|
7.22
|
6.88
|
| ROI |
27.02
|
23.35
|
24.57
|
31.11
|
26.90
|
26.17
|
Balans Expeditors International
| Balans |
2015
|
2016
|
2017
|
2018
|
2019
|
2020
|
|---|---|---|---|---|---|---|
| Eigen vermogen |
1,692
|
1,845
|
1,992
|
1,987
|
2,195
|
2,660
|
| Vreemd vermogen |
874
|
946
|
1,125
|
1,328
|
1,497
|
2,268
|
| Totaal vermogen |
2,566
|
2,791
|
3,117
|
3,315
|
3,692
|
4,928
|
| Solvabiliteit |
65.95
|
66.10
|
63.90
|
59.94
|
59.46
|
53.98
|
| Cash |
808
|
974
|
1,051
|
924
|
1,230
|
1,528
|
| Kasstroom |
565
|
529
|
489
|
573
|
772
|
655
|
| Werknemers |
0
|
0
|
0
|
0
|
0
|
|
| Omzet per werknemer |
0.0
|
0.0
|
0.0
|
0.0
|
0.0
|
|
| Kasstroom / vreemd vermogen |
0.65
|
0.56
|
0.43
|
0.43
|
0.52
|
0.29
|
Details Expeditors International
| Details |
2016
|
2017
|
2018
|
2019
|
2020
|
|---|---|---|---|---|---|
| Koers |
45.10
|
52.96
|
64.69
|
68.09
|
78.02
|
| Winst per aandeel |
2.36
|
2.69
|
3.48
|
3.39
|
4.07
|
| Koers / winst-verhouding |
19.11
|
19.69
|
18.59
|
20.09
|
28.09
|
| Dividend |
0.80
|
0.84
|
0.90
|
1.00
|
1.04
|
| Dividend % |
1.77 %
|
1.59 %
|
1.39 %
|
1.47 %
|
0.91 %
|
| Payout % |
0.34
|
0.31
|
0.26
|
0.29
|
0.26
|
| Boekwaarde |
10.26
|
11.29
|
11.58
|
12.94
|
15.71
|
| Boek / koers |
0.23
|
0.21
|
0.18
|
0.19
|
0.14
|
| Kasstroom per aandeel |
2.94
|
2.77
|
3.34
|
4.55
|
3.87
|
| Aandelen |
180
|
176
|
172
|
170
|
169
|
| Marktkap. |
8.111,55
|
9.340,77
|
11.099,64
|
11.549,56
|
19.357,08
|
Dividend Expeditors International
Koersinfo Expeditors International
|
Datum
|
Koers
|
|---|---|
|
18 apr
|
114.34
|
|
17 apr
|
115.67
|
|
09 apr
|
121.00
|
|
05 apr
|
116.15
|
|
03 apr
|
117.60
|
|
30 maa
|
121.57
|
|
22 maa
|
121.54
|
|
18 maa
|
117.23
|
|
15 maa
|
118.89
|
|
12 maa
|
120.73
|
|
11 maa
|
121.26
|
|
09 maa
|
121.26
|
|
07 maa
|
121.01
|
|
01 maa
|
119.60
|
|
29 feb
|
118.77
|
|
27 feb
|
119.30
|
|
22 feb
|
117.90
|
|
21 feb
|
115.57
|
|
20 feb
|
124.16
|
|
15 feb
|
125.74
|
|
14 feb
|
125.26
|
|
13 feb
|
126.55
|
|
09 feb
|
127.18
|
|
08 feb
|
127.61
|
|
07 feb
|
126.01
|
|
06 feb
|
124.57
|
|
05 feb
|
124.33
|
|
01 feb
|
126.33
|
|
31 jan
|
128.49
|
|
30 jan
|
128.19
|
