
Aandeel Indus Holding | Filter Basic-Info
Aandeel: Indus Holding (Duitsland small caps), ISIN: DE0006200108
| Koers | 31.20 | Hoogste koers | 33.40 |
| Laagste koers | 20.40 | 1-jrs rend. | 20.51 |
| Gem. Koersd. | 39.00 | Ver. Rend. | 25.00 % |
| Sector | Financials | Subsector | Investeringsmaatschappijen |
| Verkopen | 0 | Rating |

|
| Houden | 0 | Consensus |
|
| Kopen | 1 | ||
| Jaarverslag 2016 |
Sectorvergelijking Indus Holding
| Jaar | Omzet | Totaal omzet sector | Marktaandeel |
|---|---|---|---|
| 2019 | 1,743 | 256,000 | 0.68 % |
| 2020 | 1,559 | 231,694 | 0.67 % |
| 2021 | 1,742 | 266,667 | 0.65 % |
| 2022 | 1,804 | 312,295 | 0.58 % |
| 2023 | 1,802 | 317,920 | 0.57 % |
Adviezen Indus Holding
Nieuws Indus Holding
No Records Found
Rapporten Indus Holding
| 2017 | 2018 | 2019 | 2020 | 2021 |
|---|---|---|---|---|
Profiel Indus Holding
|
||||||||||||||||||
| ||||||||||||||||||
|
Hier vermelden we de belangrijkste zaken van het aandeel Indus Holding. We beschrijven hier in het kort:
Indus Holding's belangrijkste activiteiten liggen in de investeringssector. Het bedrijf komt uit Nederland. Andere (internationale) spelers in de sector zijn onder andere Greater China Fund, Managed Duration Investment Grade Fund, Hennessy Advisors en BlackRock.
In deze sectie treft u de jaarverslagen van aan. Het bedrijf opeert vanuit haar hoofdkantoor in Bergisch Gladbach.
Bij het investeringsbedrijf werkten eind 2019 ruim 11 duizend mensen.
Per medio 2020 bedroeg Indus Holding's koers/winst-verhouding 16. Beleggers legden dus voor 1 aandeel 16 keer de winst per aandeel over 2019 neer. Veel analisten stellen dat het aandeel op basis van haar historische dividendrendementen en koers/winst-verhoudingen als een beperkt dividend aandeel gezien kan worden.
Waarderingen en dividenden aandeel Indus Holding

Dit jaar slecht beleggingsjaar voor beleggers in Indus Holding
Rendementen aandeel Indus Holding
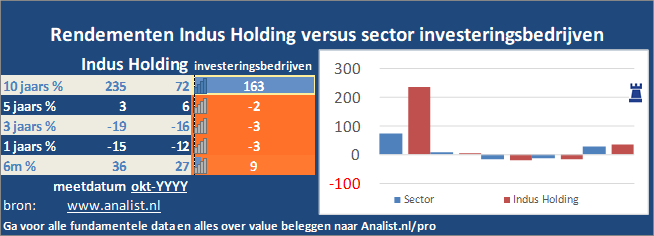 Holding 30 procent lager.
Het aandeel boekte verloor sinds 2015 gigantisch. De internationale investeringssector staat sinds 2010 90 procent in de plus. Vanaf eind 2015 staat de sector op 14 procent winst en over de voorbije 12 maanden (augustus 2019 - augustus 2020) op 7 procent verlies.
Daarmee is het aandeel een microcap.
Op de beurs was het totale bedrijf midden 2020 rond de 122,3 miljoen euro waard.
Resultaten Indus Holding
| Resultaten |
2021
|
2022
|
2023
|
2024
|
2025
|
|---|---|---|---|---|---|
| Omzet |
|
|
|
|
|
| Kosten |
|
|
|
|
|
| Nettowinst |
|
|
|
|
|
| Winstmarge |
|
|
|
|
|
| ROI |
|
|
|
|
|
Balans Indus Holding
| Balans |
2021
|
2022
|
2023
|
2024
|
2025
|
|---|---|---|---|---|---|
| Eigen vermogen |
|
|
|
|
|
| Vreemd vermogen |
|
|
|
|
|
| Totaal vermogen |
|
|
|
|
|
| Solvabiliteit |
|
|
|
|
|
| Cash |
|
|
|
|
|
| Kasstroom |
|
|
|
|
|
| Werknemers |
|
|
|
|
|
| Omzet per werknemer |
|
|
|
|
|
| Kasstroom / vreemd vermogen |
|
|
|
|
|
Details Indus Holding
| Details |
2016
|
2017
|
2018
|
2019
|
2020
|
|---|---|---|---|---|---|
| Koers |
51.64
|
59.50
|
39.00
|
38.85
|
32.10
|
| Winst per aandeel |
3.27
|
3.37
|
2.90
|
2.43
|
-1.10
|
| Koers / winst-verhouding |
15.79
|
17.66
|
13.45
|
15.99
|
-28.36
|
| Dividend |
1.35
|
1.50
|
1.50
|
0.80
|
0.80
|
| Dividend % |
2.61 %
|
2.52 %
|
3.85 %
|
2.06 %
|
2.56 %
|
| Payout % |
0.41
|
0.45
|
0.52
|
0.33
|
-0.73
|
| Boekwaarde |
26.25
|
27.44
|
28.92
|
29.69
|
27.62
|
| Boek / koers |
0.51
|
0.46
|
0.74
|
0.76
|
0.89
|
| Kasstroom per aandeel |
4.69
|
5.07
|
3.05
|
6.02
|
6.35
|
| Aandelen |
24
|
24
|
24
|
24
|
24
|
| Marktkap. |
1.262,62
|
1.454,81
|
953,57
|
949,90
|
762,86
|
Dividend Indus Holding
Koersinfo Indus Holding
|
Datum
|
Koers
|
|---|---|
|
23 mei
|
31.20
|
|
01 mei
|
29.90
|
|
28 apr
|
28.65
|
|
21 apr
|
28.85
|
|
14 apr
|
27.75
|
|
01 apr
|
26.50
|
|
30 maa
|
26.70
|
|
28 maa
|
26.70
|
|
25 maa
|
28.45
|
|
24 maa
|
28.00
|
|
19 maa
|
27.70
|
|
17 maa
|
28.70
|
|
10 maa
|
29.40
|
|
08 maa
|
29.85
|
|
03 maa
|
29.60
|
|
24 feb
|
30.05
|
|
10 feb
|
33.40
|
|
06 feb
|
32.00
|
|
04 feb
|
32.20
|
|
28 jan
|
32.15
|
|
26 jan
|
31.45
|
|
21 jan
|
29.95
|
|
17 jan
|
31.05
|
|
13 jan
|
30.65
|
|
21 dec
|
27.15
|
|
18 dec
|
26.90
|
|
17 dec
|
27.00
|
|
16 dec
|
27.35
|
|
15 dec
|
27.30
|
|
11 dec
|
27.10
|